
A comparative assessment of creation of Districts reveals that most of them were carved out of then-existing Districts, however, the purpose and criteria is not known in black and white. Therefore, the following assessment based on below fundamentals:
- Districts have been clubbed to the present Divisions they are part of. Merged Districts of FATA have not been taken being recent happening, and lack of data.
- History of creation of each District has been given, some with cited notifications, others from various websites. This does include anomalies such as Hazara District which has also been taken as Abbottabad District simply to put in perspective the fact that it was one District which then broke off into 3 in 1976
- Human Development Index, lag in infrastructure and Poverty Score to compare whether carving out a new District was to improve HDI and Poverty status detaching it from areas in previous district for presumably more input – and did that happen
- Logically population and area to indicate was that a criteria, and if so, even on that criteria can creation of most Districts be justified
- Graphic charts to put the data in perspective more pleasing to the eye
- Actual expenditure and addition to the yearly expenditure when new Districts are created, even elevation of Tehsils towards that. Would this be from their share in Provincial Finance Commission award as administrative expenditure and if so, would it not reduce spending towards poverty alleviation, human and infrastructure development.
- For assessment purpose Districts created in 1990s were taken – they are neither too ‘ancient’ nor too latest and have had 20 plus years in most cases to overcome the perceived disadvantages they faced being part of other Districts.
- As don’t have data on taxation avenues, so couldn’t assess that – but it should also be part of criteria towards new Districts as without own resource generation, the model will not succeed
NOTE: Purpose is to raise honest questions, not to give proposals.
| District | Created on | Human Development Index [1] [Rank in Pakistan out of 114] | Area [sq km] [2] | Population [3] | Lag in Infrastructure
Intra-ratio out of [20] [4] |
Poverty PMT 32.49 [5]
[%age of total Households] |
| Hazara Division | ||||||
| Abbottabad | Pre-1947 [called Hazara District till 1 Oct, 1976] | 13 | 1967 | 1,332,912 | 0.57 | 45.59 % |
| Mansehra | 1 Oct, 1976 [6] [Carved out of Abbottabad/Hazara District] | 34 | 4579 | 1,556,460 | 0.83 | 59.79 % [includes Tor Ghar too] |
| Kohistan | 1 Oct 1976
Bifurcated into Kohistan & Lower Kohistan Districts on 15 Jan, 2014 [7]
Kolai-Palas Kohistan District carved out of Lower Kohistan on 10 August, 2017 [8] |
108 | 7492 | 784,711
Upper Kohistan 306,337 Lower Kohistan 202,933 Kolai Palas 275,003
|
1.51 | 72.92 % |
| Haripur | 1991 [Carved out of Abbottabad] | 18 | 1725 | 1,003,031 | 0.78 | 53.55 % |
| Batagram | 1 July, 1993 [9] [Carved out of Mansehra] | 70 | 1301 | 476,612 | 0.65 | 83.31 % |
| Tor Ghar | 15 February, 2011 [10] [Carved out of Mansehra] | 105 | 497 | 171,395 | 0.83 | |
| Bannu Division | ||||||
| Bannu | Pre-1947 | 55 | 1227 | 1,167,892 | 0.45 | 70.21 % |
| Lakki Marwat | 1 July, 1992 [11] [Carved out of Bannu] | 59 | 3164 | 876,182 | 0.96 | 77.38 % |
| DI Khan Division | ||||||
| DI Khan | Pre-1947 | 71 | 7326 | 1,627,132 | 0.91 | 52.22 % |
| Tank | 1992 [Carved out of DI Khan] | 76 | 1679 | 391,885 | 1.23 | 81.59 % |
| Kohat Division | ||||||
| Kohat | Pre-1947 | 45 | 2545 | 993,874 | 0.77 | 69.06 % |
| Karak | 1982 [Carved out of Kohat] | 54 | 3372 | 706,299 | 1.37 | 80.87 % |
| Hangu | 1 July, [12] 1996 [Carved out of Kohat] | 57 | 1097 | 518,798 | 0.64 | 71.66 % |
| Mardan Division | ||||||
| Mardan | Pre-1947 | 29 | 1632 | 2,373,061 | 0.23 | 78.45 % |
| Swabi | 1 July, 1988 [13] | 44 | 1543 | 1,624,616 | 0.47 | 78.69 % |
| Malakand Division | ||||||
| Swat | 1969 [Princely state before that so pre-1947] | 52 | 5337 | 2,309,570 | 0.74 | 80.04 % |
| Dir | 1970 [Princely State before that so pre-1947]
Converted from Dir into 2 x Districts: Lower & Upper Dir effective 13 August, 1996 [14] |
Dir Lower 56
Dir Upper 92 |
Dir Lower 1583
Dir Upper 3699 |
Dir Lower 1,435,917 Dir Upper 946,421 |
Dir Lower 0.70
Dir Upper 1.05
|
Dir Lower 71.16 %
Dir Upper 80.35 % |
| Chitral | 1969 [Princely State before that so pre-1947]
Bifurcated into Lower and Upper Chitral on 20 November, 2018 [15] |
35 [16] | 14850
Upper Chitral: Lower Chitral 4:1 [17] |
447,362
Upper Chitral 169,240 Lower Chitral 278,122 |
1.23 | 75.54 % |
| Malakand | 1970 | 32 | 952 | 720,295 | 0.44 | 71.33 % |
| Buner | 1 Jan, 1991 [18] [Carved out of Swat] | 66 | 1865 | 897,319 | 1.02 | 81.81 % |
| Shangla | 1 July, 1995 [19] [Carved out of Swat] | 82 | 1586 | 757,810 | 1.34 | 85.59 % |
| Peshawar Division | ||||||
| Peshawar | Pre-1947 | 14 | 1257 | 4,269,079 | 0.37 | 68.18 % |
| Nowshera | 1 July, 1990 [20] [Carved out of Peshawar] | 31 | 1748 | 1,518,540 | 0.51 | 67.39 % |
| Charsadda | 1998 [Carved out of Peshawar] | 36 | 996 | 1,616,198 | 0.41 | 77.35 % |

Graph 1: Creation of Districts indicates the time-line from year 1947 till 2018, and indicates years in which Districts were created. It is evident that 1990s saw a surge in creation of Districts in Khyber Pakhtunkhwa.
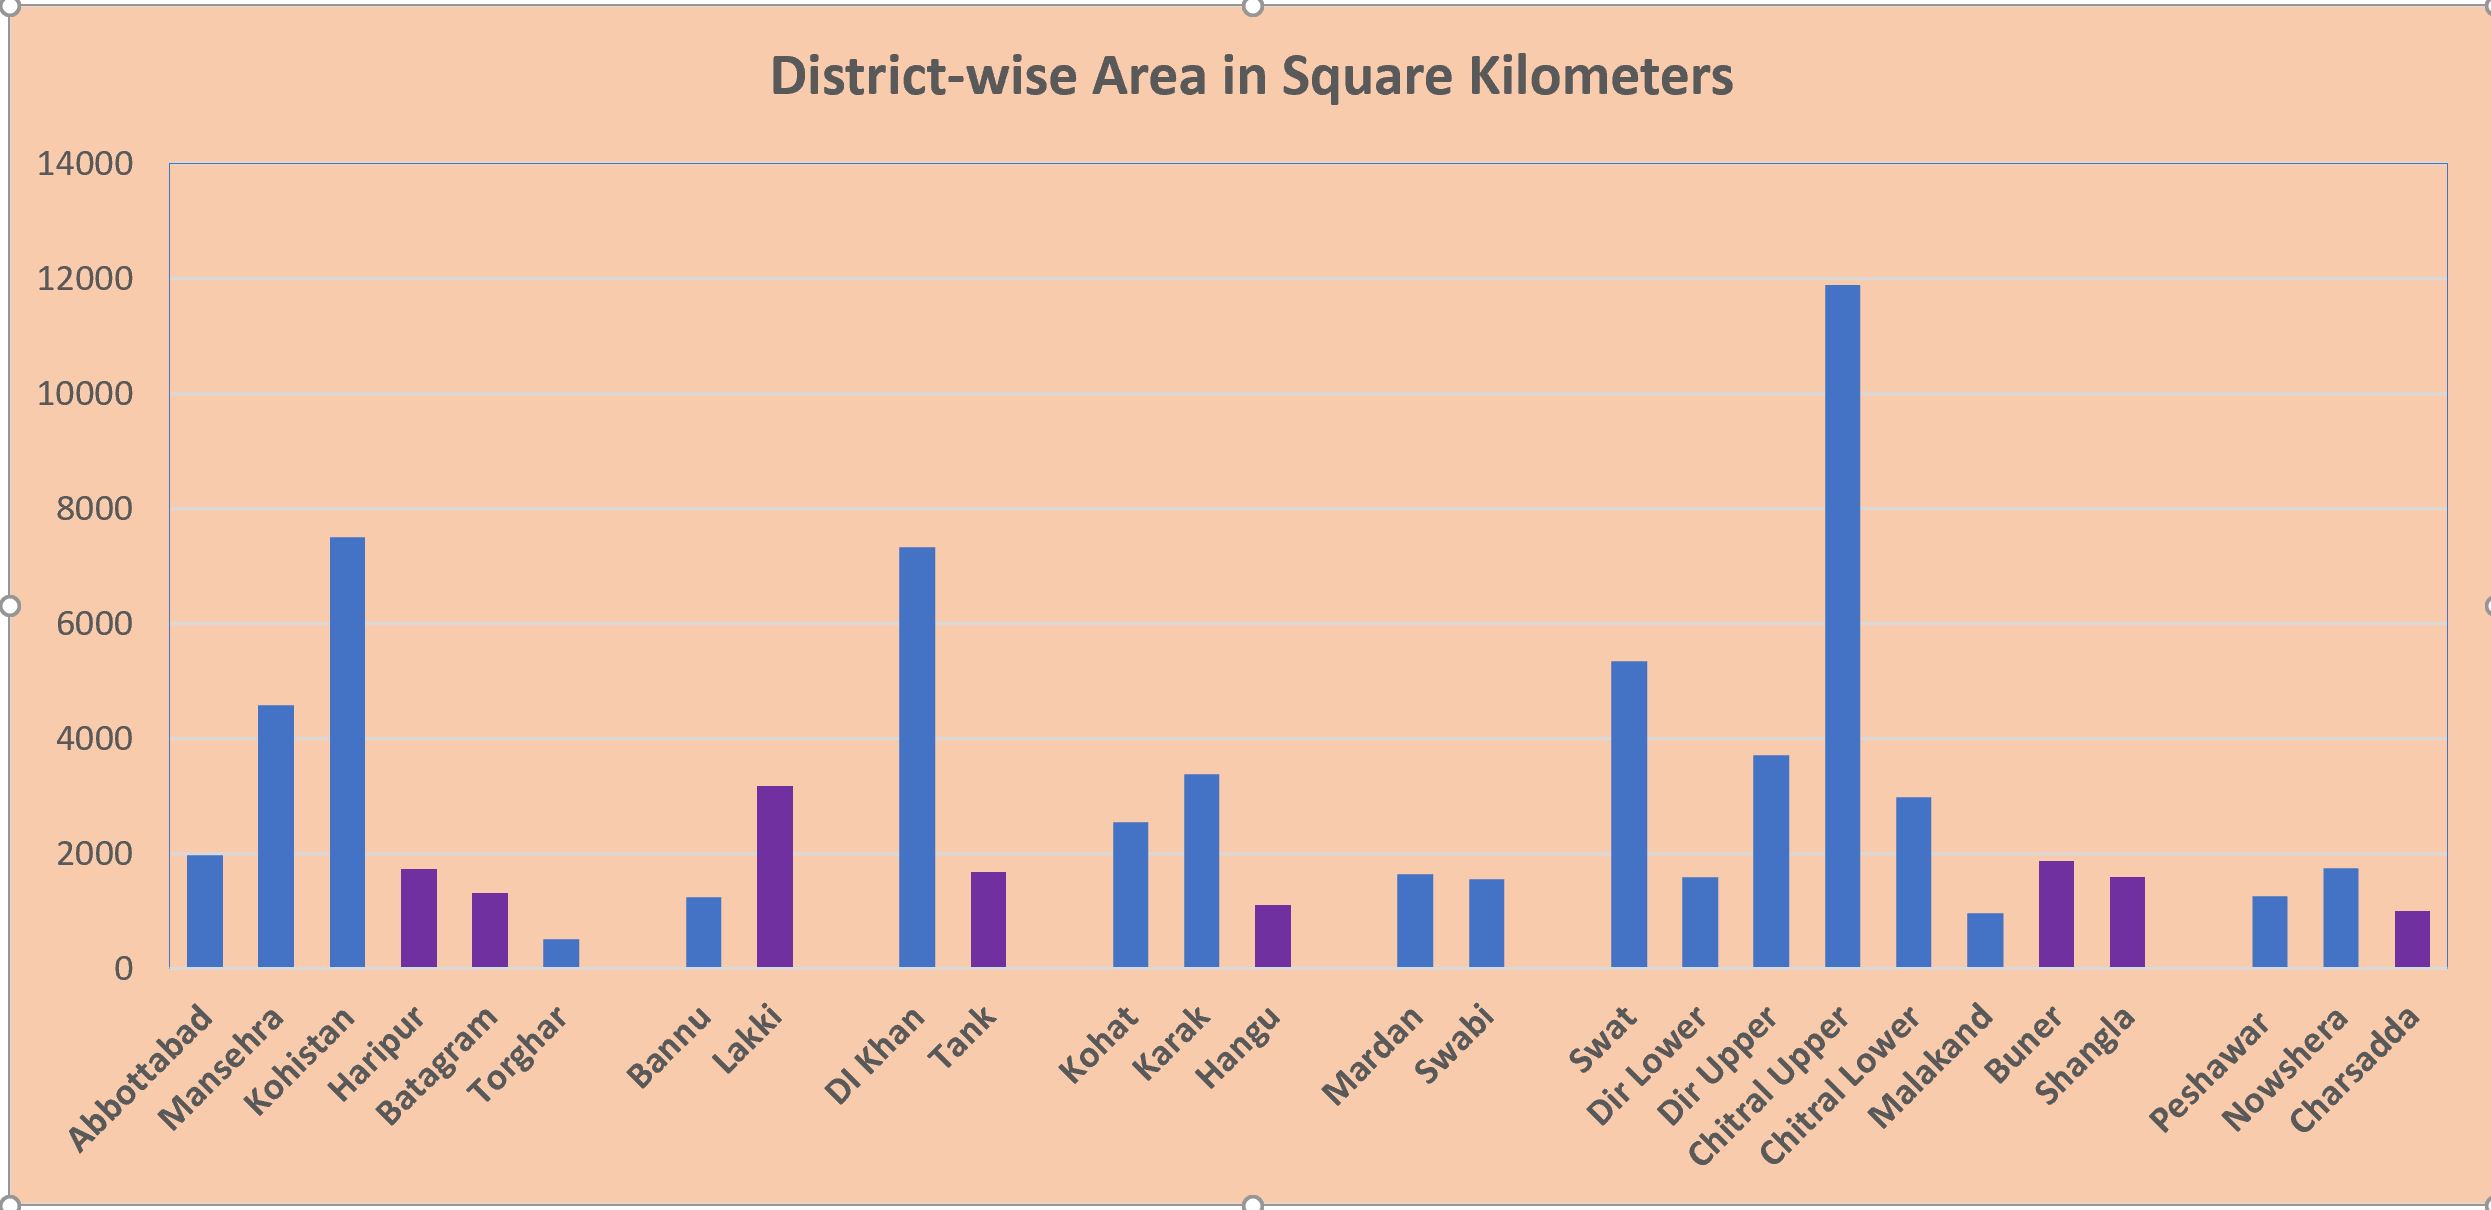
Graph 2 is Districts viz Area in square kilometers. Our of the districts being assessed, only Lakki is in area larger than the now-remaining District it was carved out. All others including Haripur from Abbottabad, Batagram from Mansehra, Tank from DI Khan, Hangu from Kohat, Buner and Shangla from Swat and Charsadda from Peshawar are still less in area from the ‘remaining parent District’ they left behind.

Graph 3 is Districts viz Population. All Districts being assessed have lesser population from their parent Districts, Haripur from Abbottabad, Batagram from Mansehra, Lakki from Bannu, Tank from DI Khan, Hangu from Kohat, Buner and Shangla from Swat, Charsadda from Peshawar.

Graph 4 indicates comparison of lag in infrastructure as part of the indicator for Provincial Finance Commission award. except for Hangu and Batagram, all other districts still show distinct lag in infrastructure from the parent District. Haripur from Abbottabad, Lakki from Bannu, Tank from DI Khan, Hangu from Kohat, Buner and Shangla from Swat and Charsadda from Peshawar. It can be presumed that their lag may have reduced, but if the purpose of their creation was investment in betterment, while 20 plus years have gone, the investment and purpose has actually not worked.

Graph 5 is the poverty score of Districts. It shows that the assessed Districts’ population is poorer that the Districts they bifurcated from. Haripur from Abbottabad, Batagram from Mansehra, Lakki from Bannu, Hangu from Kohat, Buner and Shangla from Swat and Charsadda from Peshawar. Again if the purpose was bifurcation of Tehsils from existing Districts and their elevation to distinct and separate District, arguably poverty alleviation is not a result which came out of it.
In Human Resource Index too given in first table above, Abbottabad is at 13th in Pakistan while Haripur is 18th, Mansehra is 34th while Batagram is 70th. Bannu is at serial 55 while Lakki Marwat trails it at 59. DI Khan is 71st while Tank 76th, Kohat is 45th while Hangu is 57th, Swat is at 52 while Buner and Shangla are at 66 & 82 respectively. Similarly Peshawar is at 14th while Charsadda trails at distant 36th.
Financial Implications – Human Resource creation [21]
Two types of financial implications arise out of creation of a new District, the one-time and recurrent. Creation of posts is a recurrent and permanent liability. Following table shows that 3301 posts need to be created to actualize a District with an annual recurring cost of Rs 1733 Million. P&D Department has estimated the one time cost of “Government buildings” required alone as around Rs 4 Billion.
| Department | Posts to be created (Number) | Financial Implications (PKR in Millions) |
| Revenue & Estate |
54 |
51.533 |
| Administration of Justice |
50 |
35.500 |
| Local Government, Election & Rural Development (Including VCs/NCs |
345 |
170.000 |
| District Account Office |
11 |
9.467 |
| District Education Offices [Male, Female] |
26 |
10.000 |
| District Health Office |
12 |
6.245 |
| District Food Controller |
20 |
7.081 |
| District Police Offices / Investigation offices |
1478 |
889.323 |
| Environment / Forestry |
75 |
37.000 |
| Wildlife |
45 |
23.000 |
| Industries including Consumer Protection / Industrial Departments etc |
210 |
153.559 |
| Mines & Minerals Development |
133 |
53.318 |
| Labour |
77 |
5.837 |
| Zakat & Ushr |
14 |
4.311 |
| Relief (Civil Defence) |
12 |
3.209 |
| Rescue 1122 |
135 |
46.174 |
| District Agriculture Office |
127 |
60.569 |
| Animal Husbandry |
159 |
44.516 |
| Communication & Works |
28 |
12.349 |
| District Public Health Engineering |
32 |
13.206 |
| Population Welfare |
16 |
5.205 |
| District Excise & Taxation |
74 |
24.520 |
| Prisons |
121 |
40.747 |
| Istrict Public Prosecution |
35 |
22.997 |
| District Social Welfare |
12 |
4.164 |
|
Total |
3301 | 1733.83 |
Conclusion
The selected Districts’ data reveals that they are still poorer in status in HDI, Lag in Infrastructure as well as poverty from the Districts they were carved out of or to put it in other words, the Tehsils upgraded to Districts with purpose of improving the status of their inhabitants were not able to do so.
One of the perceived reasons could be that while they lacked required funds and financial inputs – but arguably when those inputs came, the around 4 Billion plus one time and the 1 Billion plus recurring cost of their ‘status’ of District, when allocated out of their share, actually regressed their ability to spend on poverty alleviation, HDI improvement and infrastructure. They may have gotten government buildings as infrastructure but the roads, dams etc, the infrastructure of public good, may not have gotten enough funds for any worthwhile improvement.
If intent was to provide access to administrative offices, it probably would have been worthwhile to delegate authority to officers in the Tehsil instead of declaring such areas as Districts. Travelling for Domicile being made could have been reduced by bestowing the Assistant Commissioner the powers of the Deputy Commissioner. Similarly SDOs could be delegated powers of XENs & so on, if the purpose was to provide access nearer to their homes for the inhabitants, instead of creating a ful-fledged District.
A rethink of policy and criteria is probably justified for future creation of Districts as the expenditure of creation itself probably is the most pertinent blocker of its subsequent development and improvement in status. Furthermore, if within Districts, Tehsils are classified as under-developed, poorer etc, possibility of taking down the Provincial Finance Commission award to Tehsils can be also considered. After all Tehsils are integral part of the Local Governance system.
[FINAL WORD .. AS MORE DATA IS RECEIVED, THIS WRITE UP WILL BE UPDATED AND IMPROVED]
Information for reference purposes includes the Provincial Finance Commission award formula for distribution of resources among Districts. This formula is 60% weightage for population, 20% for backwardness and 20% for lag in infrastructure. Total weightage calculated gives out the share of money. The previous and latest formula on share distribution is given below.

DISTRICT WISE HOUSEHOLDS TO BE COVERED ON 32.49 PMT SCORE
| Districts | Total Number Of Households | PMT 24.51 | PMT 32.49 | Percentage (%) |
| Mardan | 230,502 | 138,862 | 180,820 | 78.45 |
| Malakand | 82,495 | 44,740 | 58,840 | 71.33 |
| Kohat | 113,461 | 60,258 | 78,359 | 69.06 |
| Chitral | 45,228 | 24,961 | 34,163 | 75.54 |
| Swabi | 171,200 | 105,839 | 134,718 | 78.69 |
| Nowshera | 169,049 | 71,586 | 113,916 | 67.39 |
| Lakki Marwat | 81,174 | 50,374 | 62,812 | 77.38 |
| Shangla | 101,700 | 71,820 | 87,042 | 85.59 |
| Upper Dir | 92,435 | 64,236 | 74,275 | 80.35 |
| Tank | 49,936 | 33,527 | 40,743 | 81.59 |
| Buner | 99,945 | 63,639 | 81,768 | 81.81 |
| Swat | 286,213 | 176,789 | 229,082 | 80.04 |
| Kohistan | 63,233 | 35,033 | 46,108 | 72.92 |
| Charsadda | 198,670 | 112,773 | 153,672 | 77.35 |
| Lower Dir | 152,336 | 84,978 | 108,397 | 71.16 |
| Battagram | 62,362 | 34,474 | 51,954 | 83.31 |
| Karak | 51,253 | 26,981 | 41,448 | 80.87 |
| Bannu | 115,377 | 59,346 | 81,008 | 70.21 |
| Hangu | 65,841 | 32,706 | 47,179 | 71.66 |
| Peshawar | 390,800 | 183,593 | 266,481 | 68.19 |
| Mansehra & Torghar | 282,712 | 119,726 | 169,042 | 59.79 |
| D.I. Khan | 314,281 | 123,819 | 164,119 | 52.22 |
| Haripur | 127,834 | 33,637 | 68,457 | 53.55 |
| Abbottabad | 177,033 | 38,233 | 80,711 | 45.59 |
| Total | 3,525,070 | 1,791,930 | 2,455,114 | 69.65 |
[1] Pakistan National Human Development Report 2017 http://hdr.undp.org/sites/default/files/reports/2847/pk-nhdr.pdf
[2] Khyber Pakhtunkhwa Bureau of Statistics
[3] 2017 Census http://www.pbs.gov.pk/sites/default/files/PAKISTAN%20TEHSIL%20WISE%20FOR%20WEB%20CENSUS_2017.pdf
[4] Based on calculations of “lag in Infrastructure” data from Provincial Finance Commission Award for Districts projected for Financial Year 2017-18. Tor Ghar data not available, so Mansehra weightage taken for it too.
[5] Households with $2 or less income, as per the poverty alleviation survey. Newer created districts are not bifurcated so are part of the old one. Mansehra includes Torghar.
[6] Government of NWFP Revenue Department Notification No. 18681 dated 20 Sep, 1976 first changing status of Hazara District of Peshawar Division to Hazara Division, then creating Districts of Abbottabad, Mansehra & Kohistan.
[7] Government of Khyber Pakhtunkhwa Board of Revenue Notification No. Rev:VII Kohistan Lower/1075 dated 15 Jan, 2014
[8] Government of Khyber Pakhtunkhwa Board of Revenue Notification No. Rev:VI/Creation of New Distt/Kolai Palas/Kohistan/16361 dated 10 Aug, 2017
[9] Government of NWFP Revenue Department Notification No 12207/Rev-VI Dated 20 June, 1993
[10] Government of Khyber Pakhtunkhwa Board of Revenue Notification No Rev:VI/Tor Ghar 2937 dated 15 Feb 2011 issued pursuant to SRO[1]/2011 dated 10 Feb. 2011 issued under signature of President of Pakistan ceasing its status as Tribal area
[11] Government of NWFP Revenue Department Notification No. 14498/Rev-VI dated 30 June, 1992
[12] Government of NWFP Revenue Department Notification No. 11014/Rev:VI dated 30 June, 1996
[13] Government of NWFP Revenue Department Notification No. 8348/REV:VI dated 30 June, 1988
[14][14] Government of NWFP Revenue Department Notification No. 23629/Rev:VI/8/96 dated 13 Aug, 1996
[15] Government of Khyber Pakhtunkhwa Board of Revenue Notification No. Rev:VI/Creation of new District Upper Chitral/37358 dated 20 Nov, 2018
[16] Chitral taken as a whole
[17] KP Board of Revenue shows figures of 10901.84 with area of Upper Chitral as 8542 and Lower Chitral as 2359.84 sq km, hence for graph purpose ratio 4:1 is taken for Upper & Lower Chitral
[18] Government of NWFP Revenue Department Notification No 23501/Rev-VI dated 10 Dec, 1990
[19] Government of NWFP Revenue Department Notification No. 21060/Rev:VI dated 11 July, 1995 [named Shanglapar]
[20] Government of NWFP Revenue Department Notification No. 9191/Rev:VI dated 23 May, 1990
[21] Source: Finance Department Khyber Pakhtunkhwa
